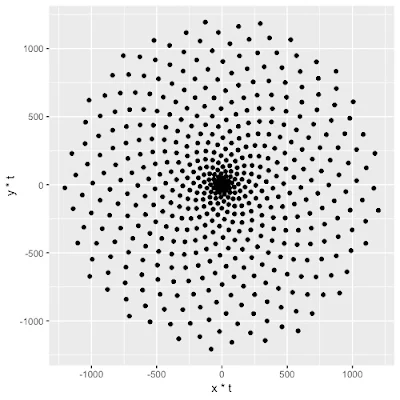

A curve that starts from a point and moves farther away as it revolves around the point is called a spiral.
These happen everywhere in nature. Spiral curves are seen in the way plants arrange their leaves in circular patterns. It turns out, rather beautifully, that these plant spirals are often formed according to something called the Golden Angle, which in turn, is related to the Golden Ratio, also seen in the Fibonacci series. I won't go into the Golden Ratio here( dude, look it up! ), but the Golden Angle seen below as angle b can be thought of this way: the ratio of the arc of b to a is the same as the ratio of a to the entire circle.
Another way to calculate it: Golden Angle = π(3 − √5) = roughly 2.4 radians = roughly 137.5 degrees.
Now, if we plot 500 points, plugging in the Golden Angle in R, the code would look like this:
# Defining the number of points
points = 500
# Defining the Golden Angle
angle = pi*(3-sqrt(5))
t = (1:points) * angle
x = sin(t)
y = cos(t)
df = data.frame(t, x, y)
resulting in
# Defining the number of points
points = 500
# Defining the Golden Angle
angle = pi*(3-sqrt(5))
t = (1:points) * angle
x = sin(t)
y = cos(t)
df = data.frame(t, x, y)
resulting in
and if we clean it up and add some color, we get
Cool. I LOVE this!


