Showing posts with label Numbers. Show all posts

7/11/23

Hello, Blob. (A Brief Encounter With Abstract Life)


Out in some math-born corner of the void, the Blobs float.


They spin. Pulse. Change color like they’re listening to music only they can hear.


Once in a while, a presence enters their realm. A viewer. A traveler. You.


The Blobs notice. They shimmer, respond.


They spin brighter, move with more purpose, like they’re dancing just for you.


This little animation started as a whim. I wrote it in Python with Processing. Just a way to make something move, something abstract.


But once the Blobs showed up, they didn’t want to leave.


And if you watch long enough, you might feel them watching back.


7/2/19

Boxed In: a look at recursion

"To understand recursion, you must understand recursion."

(How I love this.)

I made one of my little generative art animations with the idea of seeing what kind of effect I could get from recursively drawing some simple shape or shapes over and over again with small changes. 

I used just a box and a circle and came up with this:


While coding, this happens when a function being defined is applied within it's own definition, like this:
function makeBox(x,y,s)
  {
    translate(x,y);
    rotate(s/10+(col/2)%360);
    blah, blah, blah
      {
         makeBox(x+s/4, y, s/2);
         makeBox(x-s/4, y, s/2);
         makeBox(x, y+s/4, s/2);
      }
  }
In this case the function makeBox calls itself within it's own definition. This can be very powerful. And so much fun!

I hope you enjoy.

6/13/19

Latest Images

This:
and this:


based on this:

I started with the above image I generated as a part of my first foray into mandalas. The top image takes the lower one as a reference and generates random points of various sizes, sampling the reference image's color. Same for the middle image, except it paints with short strokes instead of points.

4/12/19

Latest image

The latest image from my generative art series was a nice surprise.

It started as this:
for (i in 1:500)
{
x = x*((0.98)^i)*cos(i)
y = y*((0.98)^i)*sin(i)
}

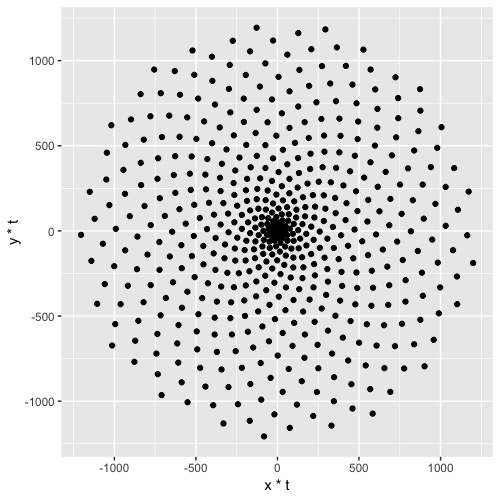
which is simple R code that generates 500 x, y points that spiral. That code gave me this:


Next, I replaced the dots with line segments. This looks much different.

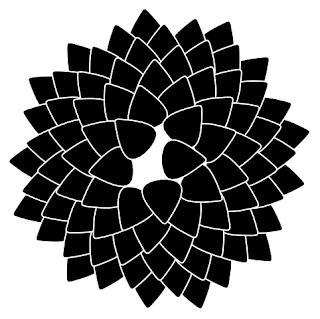
Finally, I ran an image processing script over it. The short version is that the script connects dots with a series of lines. That script spit this image out, which I love:


There are a lot of possible permutations of this I want to explore later. Like:

2/10/19

The Beauty In Numbers, 2a: Circular Matrices


I consider myself a fledgling geometer. That is, someone who is inspired by the beauty in numbers and wants to make stuff in that realm. Geometric images and like that. Some call it Sacred Geometry. I prefer to call it Inspired Geometry. So, I'm an Inspired Geometer? Okay. I can go with that.

For many months now, I have been studying and playing with transforming numbers into pictures. I've been using a programming language called R. It is an astonishingly powerful tool. I started out being interested in using it to wrangle datasets around. I'm fascinated with big data, like many others these days. But then I discovered the expressive capacity to make art. I'm hooked. Shall I call it aRt?

Besides being free, one of the benefits of R is that if is supported the world over and contains a huge depository of libraries that people have contributed that extend the capacity of R to do all sorts of things. Many are mundane. Many are wild and wonderful.

A man named Zuguang Gu has created a huge library package call circlize that takes numeric data and creates visualizations in the circular. It is an astonishing achievement IMHO.


If you're inclined, you can learn more about it HERE. And you can learn more about R HERE.

I could get lost in this package alone for years, but I've much else to do, eh? So when I found out that I can transform a simple matrix into a circular geometric shape, I quickly fell in love with the possibilities.

In it's simplest form, a matrix is a rectangular array of numbers arranged in rows and columns. Here is a 2 x 3 matrix of random numbers.
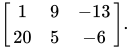


In R, you can create a 5 x 5 matrix consisting of the number 1 like this:
matrix(1, 5, 5)
It would look something like this:


The simplest one line R program to generate a visualization of this using the circlize library, might look like:
circlize::chordDiagram(matrix(1, 5, 5))
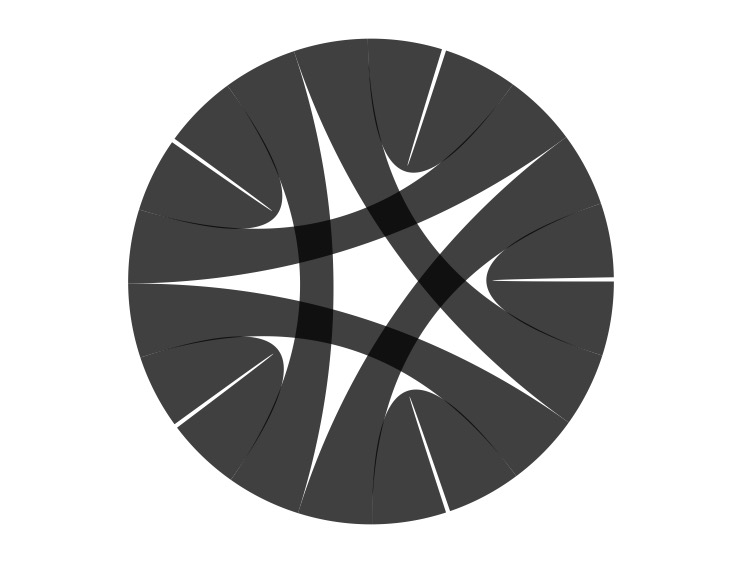
Amazingly, this one line program generates this image:

This is because circlize appends a lot of default properties to its use. In order to get to something much simpler that I liked:


I had to add more to the program, writing this:

par(mar = c(1, 1, 1, 1), bg="white")
circlize::chordDiagram(matrix(1, 5, 5),
                       col="black",
                       symmetric = TRUE,
                       transparency = 0.25,
                       annotationTrack = NULL)

I spent weeks experimenting with colors, transparency and values to get to this point:


Next I want to transfer some of these images onto a canvas with oils.  Then, make animated movies.


11/1/18

The Beauty In Numbers, 1b: A circle, a spiral, a flower.


A curve that starts from a point and moves farther away as it revolves around the point is called a spiral.


These happen everywhere in nature.  Spiral curves are seen in the way plants arrange their leaves in circular patterns. It turns out, rather beautifully, that these plant spirals are often formed according to something called the Golden Angle, which in turn, is related to the Golden Ratio, also seen in the Fibonacci series. I won't go into the Golden Ratio here( dude, look it up! ), but the Golden Angle seen below as angle b can be thought of this way: the ratio of the arc of b to a is the same as the ratio of a to the entire circle.


Another way to calculate it: Golden Angle = π(3 − √5) = roughly 2.4 radians = roughly 137.5 degrees.

Now, if we plot 500 points, plugging in the Golden Angle in R, the code would look like this:

# Defining the number of points
points = 500

# Defining the Golden Angle
angle = pi*(3-sqrt(5))

t = (1:points) * angle
x = sin(t)
y = cos(t)
df = data.frame(t, x, y)


resulting in


and if we clean it up and add some color, we get


Cool. I LOVE this!

10/3/18

The Beauty In Numbers, 1a: Plotting a circle.


Let's use math to draw pictures, shall we? There is a wonderful world out there of representing patterns in nature, especially flowers, in mathematical terms. Ever gazed into a sunflower? I hope so. I'm learning and exploring as I go along here, so I'll start with simple circle plots and move on from there. But where to start?  How about Pythagorus?

Although it is often argued that knowledge of the theorem predates him, the theorem is named after the ancient Greek mathematician Pythagoras (c. 570–495 BC) as it is he who, by tradition, is credited with its first proof, although no evidence of it exists. There is some evidence that Babylonian mathematicians understood the formula, although little of it indicates an application within a mathematical framework. Mesopotamian, Indian and Chinese mathematicians all discovered the theorem independently and, in some cases, provided proofs for special cases. (Wikipedia)

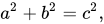
The Pythagorean theorem is a wondrous thing, having to do with the relationship among the three sides of a right triangle. The theorem states that the square of the hypotenuse (the side opposite the right angle) is equal to the sum of the squares of the other two sides. It can be written as an equation relating the lengths of the sides a, b and c, :

where c represents the length of the hypotenuse and a and b the lengths of the triangle's other two sides.

But how do we turn this into compelling pictures? We can do a lot with this if we use software programs to draw or plot, say, circles. A lot of beautiful geometric patterns come out of circles, including patterns that represent the arrangement of petals and stems in flowers. But how do we get circles out of these triangles? By expressing the Pythagorean theorem in terms of trigonometric functions.


We need to move to trigonometry because we need to move beyond solving triangles. Trigonometry give use a mathematical description of our physical world, of things that rotate or vibrate, such as light, sound, the paths of planets about the sun or satellites about the earth. We have to have angles of any size, and to extend to them the meanings of the trigonometric functions.


The Pythagorean trigonometric identity states that sin²(θ) + cos²(θ) = 1 for any real number θ. Since every (x, y) point should be in the unit circle (a circle with a radius of 1), it follows that x² + y² = 1.

Okay. Now that we've established the background information, we can begin building a series of plots. We start by creating a dataset of two variables, x and y. First, we'll draw 50 points on a circle of radius 1. 

In R, some code for drawing (plotting) 50 points in a circle looks like this:

t = seq(0, 2*pi, length.out=50)
x = sin(t)
y = cos(t)
df = data.frame(t, x, y)

# Make a scatter plot of points in a circle
ggplot(df)

Running this code results in this:


Very basic, yes? But with various enhancements and tweaks to the code, we can begin to get images that look like the geometry seen in flowers.

Thanks to @aschinchon

10/1/18

Hello, you gorgeous algorithm you.

Can there be beauty in math?  I think so. I want to experiment with this idea for awhile. So, here goes a new series: The Beauty In Numbers. I'm going to off on a tangent (!) and study mathematics and art together.
Algorithmic Beauty in Plants

Mathematics, rightly viewed, possesses not only truth, but supreme beauty—a beauty cold and austere, like that of sculpture, without appeal to any part of our weaker nature, without the gorgeous trappings of painting or music, yet sublimely pure, and capable of a stern perfection such as only the greatest art can show. The true spirit of delight, the exaltation, the sense of being more than Man, which is the touchstone of the highest excellence, is to be found in mathematics as surely as poetry. (Bertrand Russel)

Why are numbers beautiful? It's like asking why is Beethoven's Ninth Symphony beautiful. If you don't see why, someone can't tell you. I know numbers are beautiful. If they aren't beautiful, nothing is. (Paul Erdős)